Custom
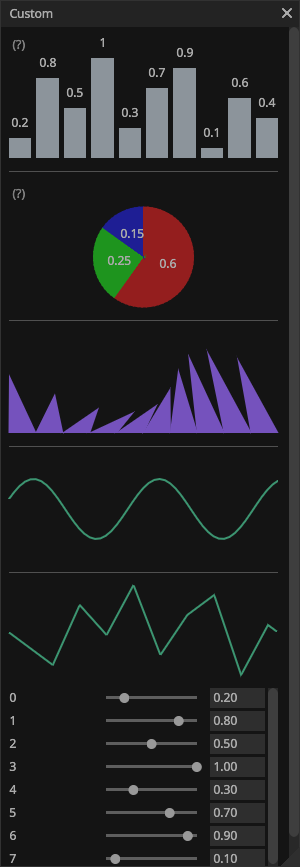
It allows you to render custom-shaped widgets instead of using predefined ones.
See the CustomDemo.cs.
using Gridrand.Contracts;
using Gridrand.RimGui.Manual.Utility;
using System;
using System.Collections.Generic;


namespace Gridrand.RimGui.Manual
{
    /// <summary>
    /// This is a demo of <see cref="Gui.Custom{TWidget}(bool, int)"/> and
    /// <see cref="Gui.CustomDelegate{TState}(TState, System.Action{Shaper, CustomDelegateWidget{TState}}, bool, int)"/>.
    ///
    /// It allows you to render custom-shaped widgets instead of using predefined ones.
    /// </summary>
    class CustomDemo : ManualBase, IManual
    {
        readonly float[] barGraphHeights = new float[] { 0.2f, 0.8f, 0.5f, 1.0f, 0.3f, 0.7f, 0.9f, 0.1f, 0.6f, 0.4f };

        readonly float[] circleGraphPercentages = new float[] { 0.6f, 0.25f, 0.15f };
        readonly Color32[] circleGraphsSegmentColors = new Color32[] { new(148, 30, 30, 255), new(30, 148, 30, 255), new(30, 30, 148, 255) };

        float[] graphDataPoints = new float[] { 0.2f, 0.8f, 0.5f, 1.0f, 0.3f, 0.7f, 0.9f, 0.1f, 0.6f, 0.4f };
        float graphOffsetX = 0f;

        public CustomDemo(ManualBaseResource p) : base(p)
        {
        }

        public void Draw()
        {
            DrawBarGraph();
            Gui.Separator();
            DrawCircleGraph();
            Gui.Separator();
            DrawWavingTriangle();
            Gui.Separator();
            DrawSin();
            Gui.Separator();
            DrawGraph();
        }

        void DrawBarGraph()
        {
            Gui.ToolTip("Hover over the graph to change color.");

            var barGraph = Gui.NextHeight(100f).Custom<BarGraphWidget>(true);

            var spacing = 5f;
            var totalSpacing = (barGraphHeights.Length - 1) * spacing;

            // Get the rectangle of the widget
            var rect = barGraph.Rect;
            // Calculate the width of each individual bar
            var barWidth = (barGraph.Rect.width - totalSpacing) / barGraphHeights.Length;

            // Initialize the bar graph widget
            barGraph.HoveredIndex = null;
            barGraph.Rects.Clear();

            for (int i = 0; i < barGraphHeights.Length; i++)
            {
                // Calculate the position and size of each bar rectangle
                barGraph.Rects.Add(new Rect(rect.x + spacing * i + barWidth * i, rect.y, barWidth, barGraphHeights[i] * rect.height));
            }

            // If input is enabled
            if (Ctx.IsInputEnabled() && Ctx.IsWindowInteractive())
            {
                // Check for mouse hover interaction with the bars
                for (int i = 0; i < barGraph.Rects.Count; i++)
                {
                    // If the mouse position is within the bounds of a bar rectangle
                    if (barGraph.Rects[i].Contains(Input.Pointer.Pos))
                    {
                        // Set the hovered index to the current bar index
                        barGraph.HoveredIndex = i;
                        break;
                    }
                }
            }

            for (int i = 0; i < barGraph.Rects.Count; i++)
            {
                var r = barGraph.Rects[i];
                using (Style.Text.AlignmentXs.Begin(AlignmentX.Center))
                    Gui.NextRect(new Rect(r.x, r.YMax, r.width, 30f)).Text(barGraphHeights[i].ToString());
            }


            // Display SubWindow if hovered.
            if (barGraph.HoveredIndex is int hoveredIndex)
            {
                DrawMousePosSubWindow(barGraphHeights[hoveredIndex].ToString());
            }
        }

        void DrawCircleGraph()
        {
            Gui.ToolTip("Hover over the graph to change color.");

            var isInputEnabled = Ctx.IsInputEnabled() && Ctx.IsWindowInteractive();

            var widget = Gui.NextHeight(100f).Custom<CircleGraphWidget>(true);
            widget.Percentages = circleGraphPercentages;
            widget.SegmentColors = circleGraphsSegmentColors;

            widget.HoveredIndex = isInputEnabled ? PieChartUtil.GetIndex(Input.Pointer.Pos, widget.Center, widget.Radius, circleGraphPercentages) : null;

            using (Style.Text.AlignmentXs.Begin(AlignmentX.Center))
            {
                for (int i = 0; i < circleGraphPercentages.Length; i++)
                {
                    var nullCenterPos = PieChartUtil.GetSegmentCenterPos(widget.Center, widget.Radius, circleGraphPercentages, i);
                    if (nullCenterPos is Vector2 centerPos)
                    {
                        Gui.NextRect(RectUtil.CreateFromCenter(centerPos, new Vector2(50, 50))).Text(circleGraphPercentages[i].ToString());
                    }
                }
            }

            // Display SubWindow if hovered.
            if (widget.HoveredIndex is int hoveredIndex)
            {
                DrawMousePosSubWindow(circleGraphPercentages[hoveredIndex].ToString());
            }
        }

        void DrawMousePosSubWindow(string text)
        {
            using (Style.SubWindow.BeginAutoSizeLayout(Input.Pointer.Pos + new Vector2(15, -15), new Vector2(50, 50)))
            {
                if (Gui.BeginSubWindow("Demo"))
                {
                    Gui.Text(text);
                    Gui.EndSubWindow();
                }
            }
        }

        void DrawWavingTriangle()
        {
            var wavingTriangleWidget = Gui.NextHeight(100f).Custom<WavingTriangle>(true);
            // You can change it if you like.
            wavingTriangleWidget.Color = new(117, 82, 189, 255);
        }

        void DrawSin()
        {
            var numPoints = 50;
            /// Defining the delegate as static can help avoid GC allocation every frame.
            ///
            /// Note: This delegate is not executed within CustomDelegate(),
            ///     but rather inside <see cref="Gui.CompleteFrame"/>.
            Gui.NextHeight(100f).CustomDelegate(
                numPoints,
                static (shaper, widget) =>
                {
                    var width = widget.Rect.width;
                    var height = widget.Rect.height;
                    var centerY = widget.Rect.Center.y;
                    var startX = widget.Rect.x;
                    var numPoints = widget.State;

                    using var points = PooledArrayList<Vector2>.Rent(numPoints + 1);

                    // Generate sine wave points from the very beginning
                    for (var i = 0; i <= numPoints; i++)
                    {
                        var t = (float)i / numPoints;
                        var x = startX + width * t;
                        var yOffset = MathF.Sin(x * 0.05f + Time.TotalTime * 3f) * height * 0.3f;
                        var y = centerY + yOffset;
                        points.Add(new Vector2(x, y));
                    }

                    // Draw anti-aliased polyline with all points
                    shaper.AddLineAA(points.AsSpan(), thickness: 2f, feather: 1f, color: new Color32(60, 149, 113, 255));
                },
                true);
        }

        void DrawGraph()
        {
            graphOffsetX += Time.DeltaTime * 2f;

            Gui.NextHeight(100f).CustomDelegate(
                graphDataPoints,
                graphOffsetX,
                static (shaper, widget) =>
                {
                    var dataPoints = widget.State1;
                    var offsetX = widget.State2;

                    var y = widget.Rect.YMin;
                    var width = widget.Rect.width;
                    var height = widget.Rect.height;
                    var xStart = widget.Rect.XMin;

                    var dataLength = dataPoints.Length;

                    var length = (int)width;
                    using var positions = PooledFixedList<Vector2>.Rent(length);

                    for (int i = 0; i < length; i++)
                    {
                        var normalizedX = (float)i / width;
                        var timeIndexFloat = offsetX + normalizedX * dataLength;

                        var index1 = MathUtil.FloorToInt(timeIndexFloat) % dataLength;
                        var index2 = (index1 + 1) % dataLength;

                        // Interpolation coefficients
                        var t = timeIndexFloat - MathUtil.FloorToInt(timeIndexFloat);
                        var dataValue = MathUtil.Lerp(dataPoints[index1], dataPoints[index2], t);

                        var x = xStart + i;
                        var yPos = y + dataValue * height;
                        var currentPoint = new Vector2(x, yPos);

                        positions.Add(currentPoint);
                    }
                    shaper.AddLineAA(positions.AsSpan(), thickness: 2f, feather: 1f, color: new Color32(60, 149, 113, 255));

                },
                true);

            if (Gui.BeginScroll())
            {
                for (int i = 0; i < graphDataPoints.Length; i++)
                {
                    Gui.LabelSliderInputFloat($"{i}", ref graphDataPoints[i], 0f, 1f);
                }

                Gui.EndScroll();
            }
        }

        class WavingTriangle : PrimitiveWidget
        {
            // Frequency on the X axis
            public float FrequencyX { get; set; } = 1.5f;
            // Frequency on the Y axis
            public float FrequencyY { get; set; } = 2.5f;
            // Amplitude of the oscillation
            public float Amplitude { get; set; } = 30f;
            // Time progression
            public float TimeScale { get; set; } = 1f;
            public Color32 Color { get; set; } = new(155, 99, 71, 255);
            public int TriangleCount => 10;

            public override void Build(Shaper shaper)
            {
                float time = Gridrand.Time.TotalTime * TimeScale;
                float spacing = Rect.width / TriangleCount;

                for (int i = 0; i < TriangleCount; i++)
                {
                    var x = Rect.x + i * spacing;
                    var normalizedIndex = (float)i / TriangleCount;

                    // Lissajous-like offset (complex time-based position calculation)
                    var offsetX = (float)Math.Sin(time * FrequencyX + normalizedIndex * AdvancedMathUtil.PI * 2f) * Amplitude;
                    var offsetY = (float)Math.Cos(time * FrequencyY + normalizedIndex * AdvancedMathUtil.PI * 2f) * Amplitude;

                    var top = new Vector2(x + spacing * 0.5f + offsetX, Rect.Center.y + offsetY);
                    var left = new Vector2(x, Rect.y);
                    var right = new Vector2(x + spacing, Rect.y);

                    ReadOnlySpan<Vector2> points = stackalloc Vector2[] { left, top, right };
                    shaper.AddConvexPolygonAA(points, Color, 1f);
                }
            }
        }

        class BarGraphWidget : PrimitiveWidget
        {
            public int? HoveredIndex { get; set; }
            public List<Rect> Rects { get; set; } = new();
            public Color32 Color { get; set; } = new(140, 148, 155, 255);
            public Color32 HovredColor { get; set; } = new(138, 43, 116, 255);

            public override void Build(Shaper shaper)
            {
                for (int i = 0; i < Rects.Count; i++)
                {
                    shaper.AddRect(Rects[i], HoveredIndex == i ? HovredColor : Color);
                }
            }
        }

        class CircleGraphWidget : PrimitiveWidget
        {
            public int? HoveredIndex { get; set; }
            public float[] Percentages { get; set; }
            public Color32[] SegmentColors { get; set; }
            public Color32 HoveredColor { get; set; } = new(60, 60, 60, 255);

            public Vector2 Center => Rect.Center;
            public float Radius => Math.Min(Rect.width, Rect.height) / 2f;

            public override void Build(Shaper shaper)
            {
                var currentAngle = 0f;
                var center = Rect.Center;

                for (int i = 0; i < Percentages.Length; i++)
                {
                    var angle = Percentages[i] * 360f;
                    var startAngle = currentAngle;
                    var endAngle = currentAngle + angle;

                    var color = GetColor(i);

                    var segmentCount = Math.Max(1, (int)Math.Ceiling(angle / 5f));
                    var step = angle / segmentCount;

                    for (int j = 0; j < segmentCount; j++)
                    {
                        var segStartAngle = startAngle + j * step;
                        var segEndAngle = segStartAngle + step;

                        // Convert angles to radians and adjust for clockwise drawing starting from the top (0 degrees).
                        var a0 = (-segStartAngle + 90f) * MathUtil.Deg2Rad;
                        var a1 = (-segEndAngle + 90f) * MathUtil.Deg2Rad;

                        var point1 = center + new Vector2(MathUtil.Cos(a0), MathUtil.Sin(a0)) * Radius;
                        var point2 = center + new Vector2(MathUtil.Cos(a1), MathUtil.Sin(a1)) * Radius;


                        ReadOnlySpan<Vector2> points = stackalloc Vector2[] { point2, center, point1 };
                        shaper.AddConvexPolygonAA(points, color, 1f);
                        //shaper.AddTriangle(point2, center, point1, color, color, color);
                    }

                    currentAngle = endAngle;
                }
            }

            Color32 GetColor(int i)
            {
                if (HoveredIndex == i)
                    return HoveredColor;

                if (i < SegmentColors.Length)
                    return SegmentColors[i];

                return Color32.White;
            }
        }
    }
}